

The S&P 500 hit a new closing high Tuesday last week, its first new high since August 13. A new high confirms we’re still in a bull market and this one is timely, since today (Monday, October 12) is the bull market’s fourth birthday. The S&P 500 had a total return of 131% (including dividends) over that period, including a solid 1.2% pickup last week. That may not sound like much compared to 131%, but that’s a good week. (Incredibly, the Bloomberg Gold Index is better with a 144% return since October 12, 2022, while the Bloomberg Aggregate Bond Index is up only 15%.)
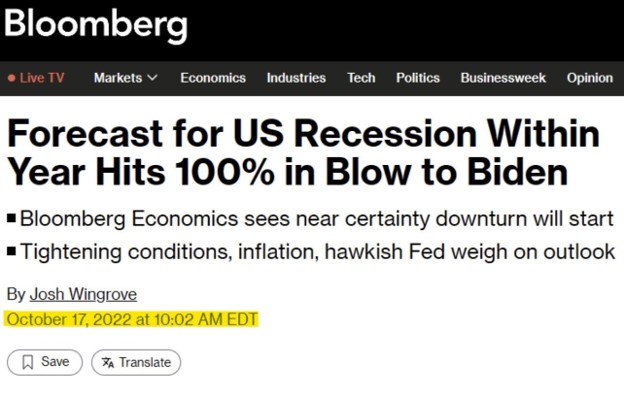
What a ride the past four years have been. We were one of the very few places that was bullish in late 2022, with so many seeing a recession and bear market ahead. We took a lot of heat for our optimistic outlook, as you always will when you go against the herd. The now infamous Bloomberg headline below sums up just how negative sentiment was this time four years ago. All the economy did in 2023 was grow faster than China (if you include inflation) for the first time in a generation.
The turnaround that started on October 13 four years ago ended a vicious 10-month bear market that fell 25%, one that saw many of the same high-flying tech/AI names of today fall 50% or more.
Happy birthday
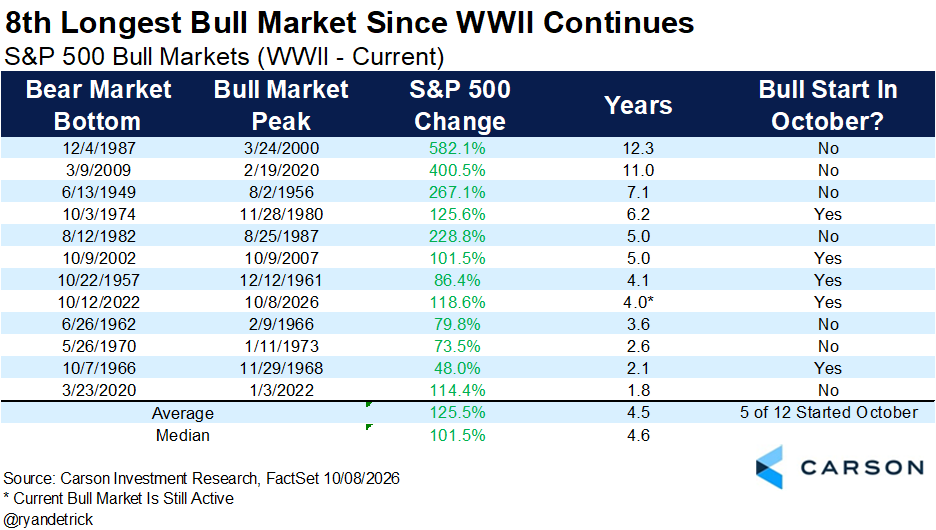
We found seven other bull markets since 1950 that made it to their fourth birthday, and as you can see here, this one is the third-best start to a bull market ever for this cohort.

Here are all the bull markets since 1950, and this one is now the eighth longest ever. Even here, more have been longer than shorter, and several much longer.
How long with this last?
A year ago, we discussed why this bull market very well could have years left. Even a year older, it may have plenty of room to run.
The bottom line is that bull markets are like cruise ships. Once they get moving, they are hard to slow down, hard to stop, and very hard to turn around. We’ve been saying this for years now, and the takeaway here is there’s still a good chance this bull continues to surprise.
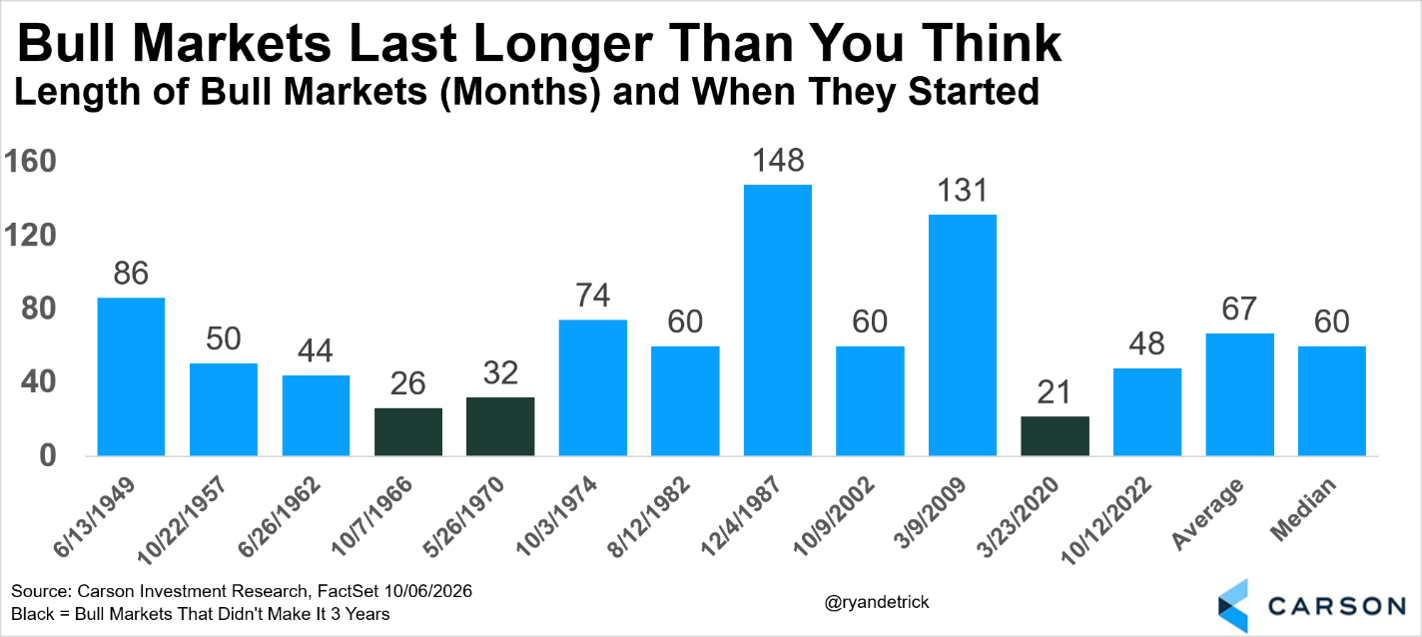
Here’s a chart we’ve been sharing for a long time now, and it shows that once a bull market has its third birthday, the trend usually becomes resilient. We’ve seen some bull markets flame out after a couple of years, but once they hit that third year, they have been hard to stop, just like a cruise ship moving out at sea.
The last time we saw a bull market get past its fourth birthday and not make it to five was in the early 1960s. In other words, over the past fifty years, if a bull made it this far it made it to at least its fifth birthday, and the average ultimate length of those bull markets was eight years. Is this bull only halfway over? We aren’t saying that, but we are saying be open to this bull market moving higher for longer than you think.
Year five could be another good one
A year ago, we said similar things, and the S&P 500 is up more than 19% since the bull market turned three.
Looking at year five of previous bull markets, only once did we see a bear market during that year (thus ending the bull market), and that was way back in the early 1960s.
In fact, year five has gained an average of nearly 19%, more than double the average yearly return. We are still formulating our 2027 Outlook, but it is safe to say we may see another year of above-average returns, and we sure wouldn’t complain if stocks gain close to 20% over the next 12 months.
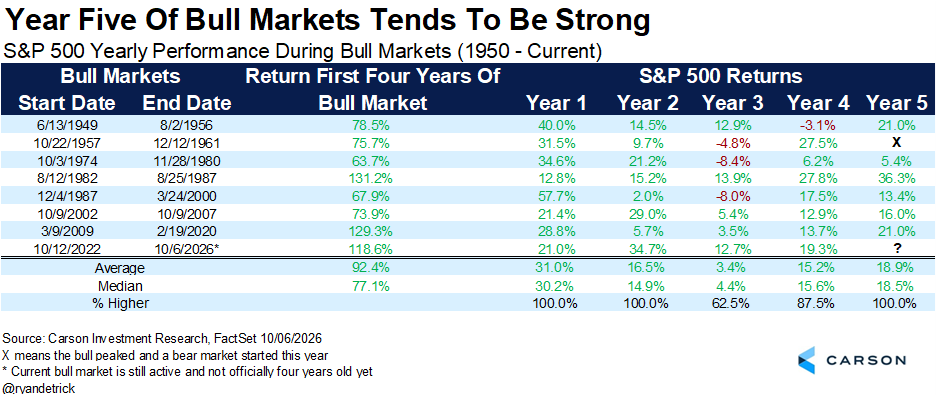
What really stands out about the above data, though, is how well things did in year five of the two bull markets that were off to a better start than this one. Year five of the 1980s bull market soared 36%, and year five of the 2010s bull added another 21%. Again, be open to the possibility of continued gains and even potentially quite strong returns over the next year.
Midterm elections don’t matter a whole lot to markets, but here’s what might
We are about three weeks from the November 3 midterm elections, and we’ve been getting questions on what the outcome might mean for markets. The short answer is typically not a lot. Political outcomes matter broadly, of course, but they tend to mean a lot less for markets than people think, and even more so for midterms. One of our most enduring pieces of market advice is to generally ignore your political enthusiasm or anxiety when making investment decisions. It rarely serves investors well.
There are other reasons midterms don’t usually have a large impact, beyond markets generally being indifferent to the party in power. Presidents typically pass their signature legislation in their first two years, and the president’s influence usually wanes after midterms, especially for second-term presidents. Midterms are also usually a check on presidential power (more on that below).
Here are the basics on the upcoming election:
- Republicans currently control both the House (219–214) and Senate (53–47) by fairly narrow margins.
- Given the Republicans’ narrow majority in the House and the historical tendency of the president’s party to lose ground at midterms, Democrats are likely to take control.
- The Senate is closer to a coin toss, although there is some recent evidence that suggests the odds may now tilt in favor of Democrats taking control.
- Whatever the outcome, Donald Trump will still be president and anything properly within the scope of the executive branch will continue as before, although we could see a legislature more likely to check executive power that oversteps its constitutional bounds, especially relative to the constitutionally defined role of the legislative branch.

The battle for Senate control currently tilts toward Democrats
Since Senate terms are for six years, approximately one-third of the Senate faces voters during each federal election (midterm or presidential election years), unlike the House, where every seat is up for election every two years. That means the “map” of which seats are up for election can matter, but despite the map, the number of safe versus at-risk seats can matter more. This year, 35 seats are being contested: 33 that are part of the regular cycle plus special elections in Florida and Ohio. Twenty-two of those seats are currently held by Republicans and 13 by Democrats. But most of those are considered safe, so the number of seats that have a real possibility of switching parties is much narrower.
Republicans currently control the Senate 53–47. The vice president is the tie-breaking vote in the Senate, so Republicans can lose a net of up to three seats and retain control, and Democrats have to net +4 seats to take control. While polls and other factors that impact midterm elections have been improving for Democrats and they have become small favorites, we would still call the battle for Senate control close to a coin flip.
How might Democrats get there? First, if Democrats are to take control, they need to hold serve. If they lose even a single seat, not only does it raise the number they have to flip, but it also signals they are not having a strong night. Michigan, New Hampshire, and more recently Minnesota are considered the most vulnerable Democratic seats. If Democrats lose any of these, there are still paths to Democrats taking control, but the odds have grown long.
North Carolina, where Democrats are currently favored, is the most likely seat to flip from the Republicans to the Democrats. The Democratic advantage in North Carolina is fairly strong, although not a lock. If Democrats can’t flip North Carolina, they are unlikely to be able to flip four of the more closely contested current Republican seats while avoiding losing seats themselves.
If Democrats hold Michigan, Minnesota, and New Hampshire and flip North Carolina, they would need to flip three more current Republican seats to take control. The most vulnerable current Republican seats (outside North Carolina), in rough order of vulnerability from most to least, are Alaska, Maine, Texas, Ohio, and Iowa.
From a Republican perspective, they can retain control of the Senate losing North Carolina if they hold three of those five. If they flip Michigan or one of the other vulnerable Democratic seats, they only need to hold two of five.
Historically, the Senate has not moved against the president’s party as much or as often as the House. But a lot depends on “the map.” Senators also tend to have broader appeal, as everyone in the state votes for senators, while you only vote for a representative in your district. Since 1914, the first election after the passage of the 17th Amendment, when senators moved from being appointed by state legislatures to popular vote, the president’s party has lost an average of 3.5 Senate seats during midterms and lost seats in 19 out of 28 elections, or a little worse than two-thirds of the time. Looking just at the post-WWII period (since 1946), the average is a similar 3.6 seats lost, with the president’s party losing ground 13 out of 20 times.
History is on the side of Democrats taking control of the House
The story in the House is more dire for Republicans. If you exclude 1902, when the election was impacted by House expansion following the 1900 census and Democrats already picked up seats, the president’s party has lost ground in every election since 1862 except for three: 1934 (FDR’s first midterm and the best midterm performance in modern presidential history), 1998 (Bill Clinton’s second midterm), and 2002 (President George W. Bush post-9/11). Since 1946, the president’s party has lost an average of 25.7 seats in midterms, losing ground 18 out of 20 times.
Right now, the Republicans have control of the House by a 219 to 214 count (that includes an independent who caucuses with Republicans), with two seats vacant, one that had been held by a Republican and one that had been held by a Democrat. That means a three-seat swing flips control of the House. Were all else equal, Democrats would already be favored to take control of the House given history. Add in the president’s approval rating, an unpopular war, and concerns about inflation, and it’s a very tall order for Republicans to maintain House control. But elections are decided by voters, not models, and sometimes surprise, so Republicans’ chance of maintaining control is non-negligible.
Republicans also have a structural advantage from district construction and the tendency of Democratic voters to be more clustered in dense urban centers. Each congressional district votes only for its own candidate, but a rough estimate is that Democrats need to win the national House vote by roughly 3–4% to have a 50/50 chance of controlling the House. The Real Clear Politics polling average for the generic congressional vote, for what it’s worth, currently has Democrats at +7.9%.
Markets seem to like mixed government
The most important outcome of the midterms for markets may simply be structural. Markets seem to like mixed government. You can choose your reason why. Maybe when a single party rules, it tends to give in to its own excesses and become the worst version of itself. Or it could be that the process of compromise leads to better government. Or maybe it’s that gridlock is good: government functions best when it governs least. Likely it’s some combination, depending on circumstances.

The stock market has certainly been happy the last couple of years despite unified government, helped by stimulus and a Fed willing to let the economy run hot, but independent of all that (and most important) by strong earnings growth supported by the AI boom. Earnings gains due to the massive buildout of AI infrastructure are genuine, but we would caution that a meaningful chunk of those gains are supported by capex spending not appearing immediately on income statements and by large gains in private company valuations (such as Anthropic and OpenAI) on some major tech firms’ books. Still, the earnings boom has been extraordinary.
Bond yields may see less pressure post-election
Bond yields have been on a tear. Both the 10-year and 5-year Treasury yields have reached levels not seen since the mid-2000s, before the Great Financial Crisis. We’ve written quite a bit about the combined impact of inflation, government deficits, oil prices, and AI-debt demand on yields. Since the start of the conflict in the Middle East and the consequent closing of the Strait of Hormuz, the 10-year Treasury yield has climbed sharply from 3.95% to as high as 5.31%.
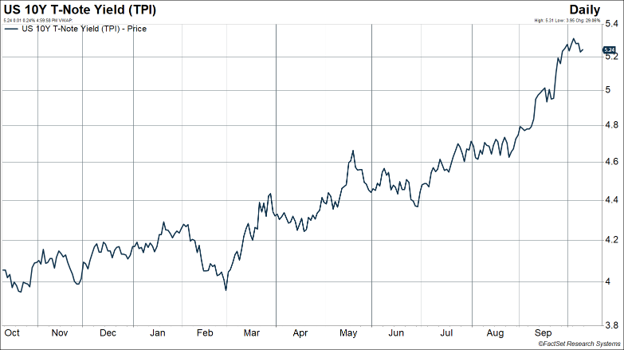
The election outcome may help limit added pressure on yields for two main reasons. First, additional checks and balances may help rein in some policy excesses. Second, Republicans will no longer be able to use the reconciliation process, which only requires a simple majority, to pass additional tax cuts or spend as freely. However, mixed government may still imply stimulus, as legislative horse trading may mean both parties get to spend on some favored initiatives.
Republicans and Democrats both like to spend
If there’s one thing politicians from both parties have in common, it’s a love of spending more than the government takes in. Granted, priorities are different, but there’s no real argument that either party is the party of fiscal discipline, and our current president fits right in. Both parties make a similar claim about their spending habits that may be true in theory: that it’s investment that will eventually pay for itself. Perhaps, but given the direction of deficits, it doesn’t seem we’ve received much return on investment.
The Trump administration has been particularly profligate given the absence of a major economic disruption or major war (the conflict in the Middle East notwithstanding). As seen below, the primary deficit (the deficit excluding interest payments, which makes for a better apples-to-apples comparison) is stable right now rather than showing the improvement more typical of a healthy expansion. Of course, interest does need to be paid when the government borrows, and while including interest payments may not lead to as neutral a comparison across time, it is part of the practical reality as rates move higher.
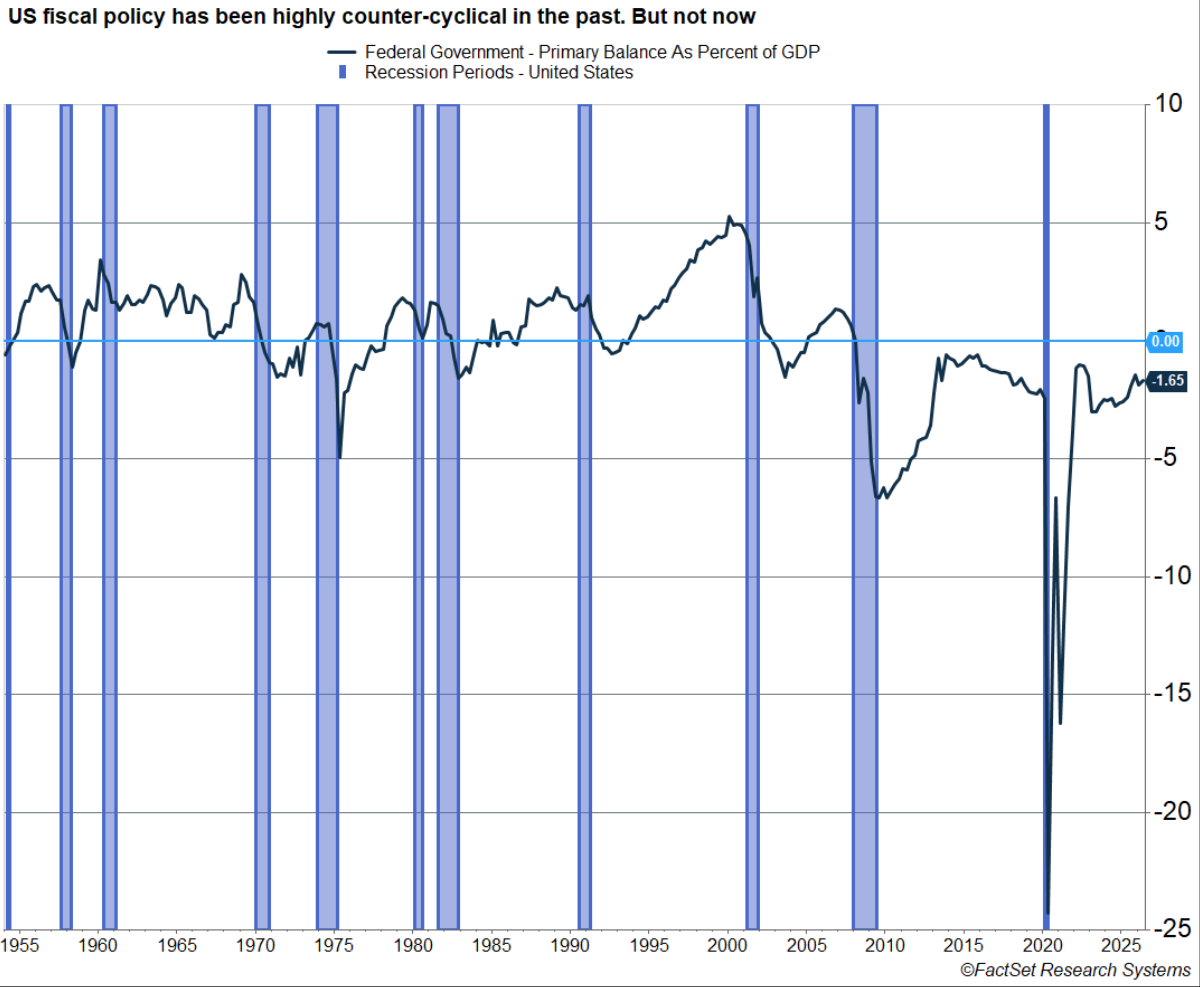
The takeaway here is that deficits probably won’t be as bad as they might otherwise be with mixed government, but mixed government will by no means move us to a period of austerity. And whatever the dangers in the longer run, it’s important to remember that in the near term, markets like stimulus, as deficit spending supports corporate profits.
The wisdom of the electorate
There’s an old saying, famously quoted by Winston Churchill, that democracy is the worst form of government except for all the other ones. The electorate is not always truly wise, but democracy as a form of government creates a dynamic where mistakes are often minimized via accountability. Nearly every president has faced that reckoning in midterm elections. We don’t expect President Trump to be the exception. Maybe that’s part of why the third year of the presidential cycle historically is the strongest for markets. It’s the point at which the hubris of a new president, flush with success from winning an election, is finally reined in. That has held true for both Republican and Democratic presidents. From that cyclical perspective, gridlock is good.

S&P 500 — A capitalization-weighted index of 500 stocks designed to measure performance of the broad domestic economy through changes in the aggregate market value of 500 stocks representing all major industries.
The NASDAQ 100 Index is a stock index of the 100 largest companies by market capitalization traded on NASDAQ Stock Market. The NASDAQ 100 Index includes publicly traded companies from most sectors in the global economy, the major exception being financial services.
The views stated in this letter are not necessarily the opinion of Cetera Wealth Services LLC and should not be construed directly or indirectly as an offer to buy or sell any securities mentioned herein. Investors cannot invest directly in indexes. The performance of any index is not indicative of the performance of any investment and does not take into account the effects of inflation and the fees and expenses associated with investing.
A diversified portfolio does not assure a profit or protect against loss in a declining market.
All investing involves risk, including the possible loss of principal. There is no assurance that any investment strategy will be successful. This information is from sources believed to be reliable, but Cetera Wealth Services, LLC cannot guarantee or represent that it is accurate or complete.
9161464.1-1026-C
